To gain an edge, this is what you need to know today.
Tech Insiders Sell
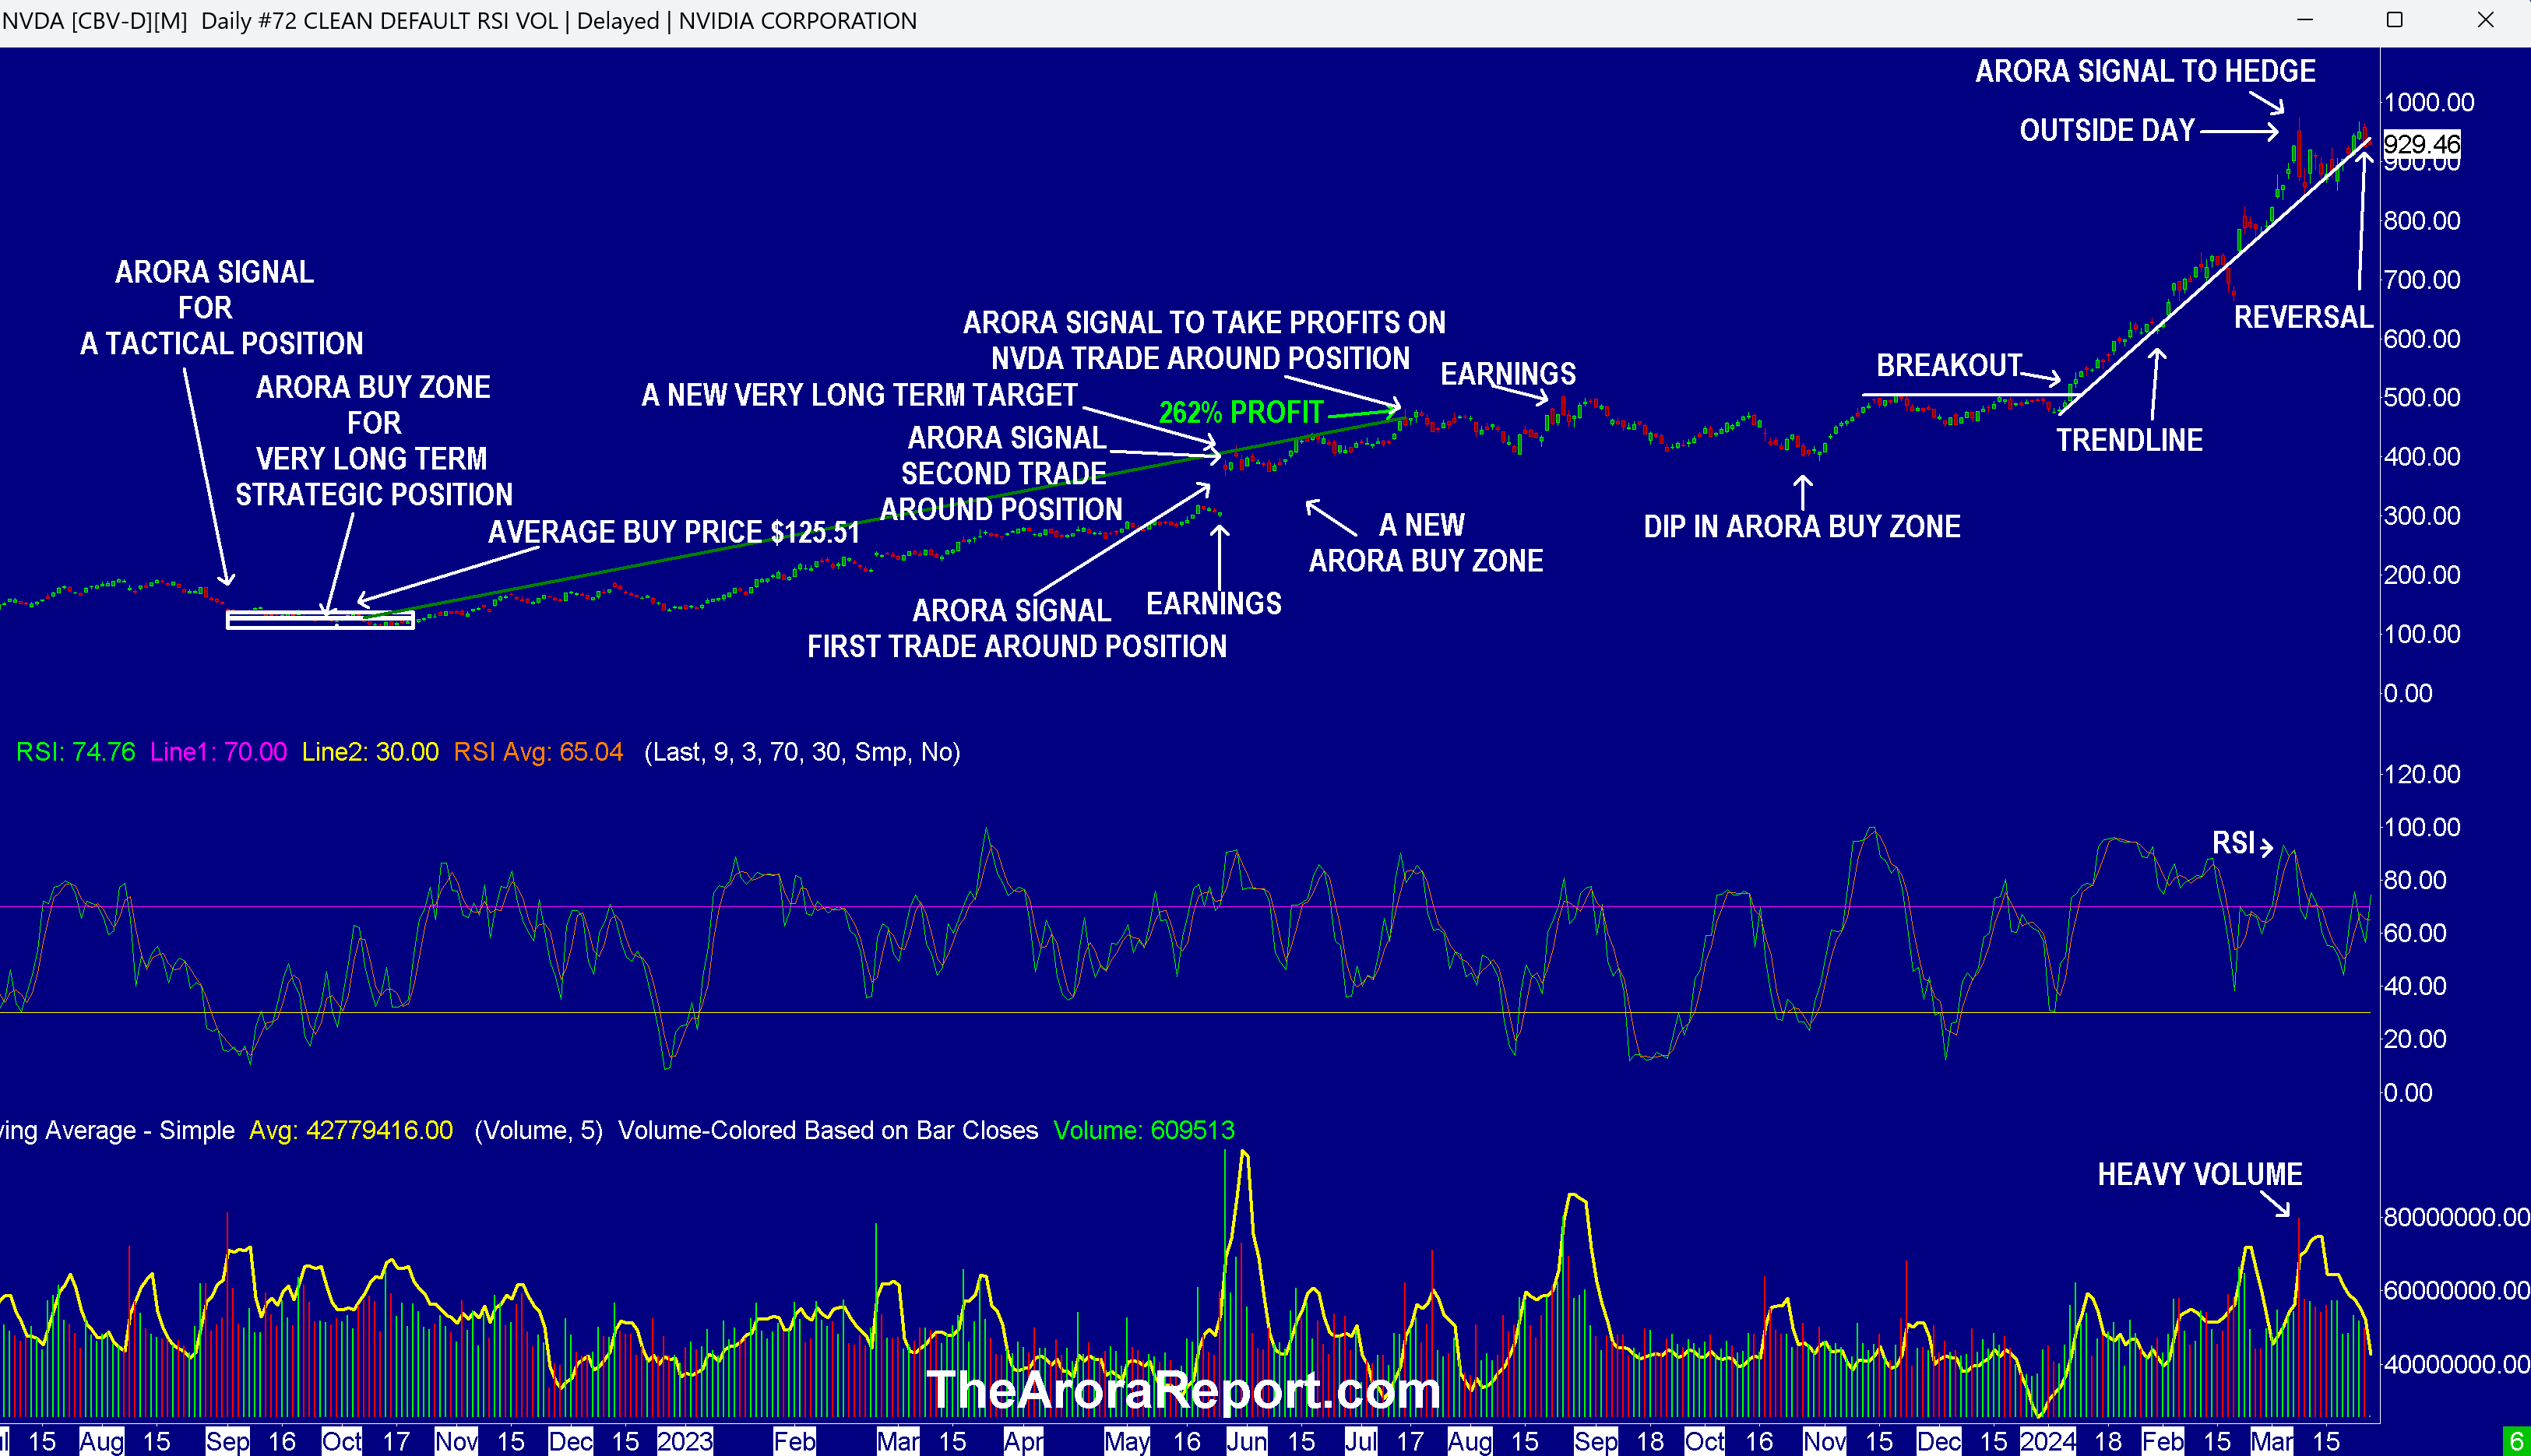
Please click here for an enlarged version of the chart of NVIDIA Corp (NASDAQ:NVDA).
Note the following:
- This article is about the big picture, not an individual stock. The chart of NVDA stock is being used to illustrate the point.
- NVDA is the center of the AI revolution and as such is the most important stock in this market at this time. As is often the case, the chart shows crosscurrents.
- The chart shows an outside day. An outside day is a negative pattern in traditional technical analysis. For details, please see a prior Morning Capsule.
- The chart shows that the pullback after the outside day was bought and the trendline held.
- The chart shows yesterday Nvidia had a major reversal. In a major reversal the stock opens near the high of the day but then drops, closing near the low of the day. This is a negative pattern.
- Of comfort to bulls is that the volume was not heavy on the reversal. This indicates a lack of conviction. However, most of the drop occurred during the last hour of trading. This is a negative.
- Smart money tends to be most active in the last hour of trading. In contrast, the momo crowd is most active in the first hour of trading.
- The chart shows that on the bullish side, both on the outside day and reversal day, the trendline held. This is a positive.
- RSI on the chart shows that NVDA stock can go either way.
- $1000 is the magnet for NVDA day traders and option buyers.
- Pay close attention to the NVDA chart as what happens to NVDA will likely determine the course of the stock market in the near term.
- Tech insiders from Amazon’s Bezos to Meta’s Zuckerberg are aggressively selling their tech stock holdings.
- There is always some insider selling, but the insider selling taking place now in tech stocks is out of the ordinary.
- Insiders are more knowledgeable about their companies than outsiders. Insiders are taking advantage of the momo crowd’s exuberance to unload their shares to the momo crowd.
- Insiders are included in the smart money data that we publish.
- The ratio the corporate tech insider selling to buying has reached the highest level in three years.
- In The Arora Report analysis, just like sentiment, insider selling is a yellow light but not a precise timing signal.
- There is all kinds of analysis on the economic impact of the Baltimore bridge disaster. Baltimore is one of the busiest ports. Some analysts are warning of a negative impact on the national economy. In The Arora Report analysis, with the exception of coal exports and auto imports, there is going to be no national impact. Other ports on the East Coast have spare capacity.
- As an actionable item, the sum total of the foregoing is in the protection band, which strikes the optimum balance between various crosscurrents. Please scroll down to see the protection band.
Quarter End Window Dressing And Rebalancing
Quarter end window dressing is taking place. In quarter end window dressing, some money managers buy the best performing stocks and sell the worst performing stocks so that they can show their clients that at the quarter end, they were holding the best performing stocks.
In quarter end rebalancing, some money managers are selling stocks and buying bonds. The reason is that stocks have done better than bonds and money managers attempt to maintain a fixed ratio between stocks and bonds.
Magnificent Seven Money Flows
In the early trade, money flows are positive in NVDA, Apple Inc (NASDAQ:AAPL), Amazon.com, Inc. (NASDAQ:AMZN), Alphabet Inc Class C (NASDAQ:GOOG), Meta Platforms Inc (NASDAQ:META), Microsoft Corp (NASDAQ:MSFT), and Tesla Inc (NASDAQ:TSLA).
In the early trade, money flows are positive in SPDR S&P 500 ETF Trust (NYSE:SPY) and Invesco QQQ Trust Series 1 (NASDAQ:QQQ).
Momo Crowd And Smart Money In Stocks
The momo crowd is buying stocks in the early trade. Smart money is inactive in the early trade.
Gold
The momo crowd is buying gold in the early trade. Smart money is inactive in the early trade.
For longer-term, please see gold and silver ratings.
The most popular ETF for gold is SPDR Gold Trust (NYSE:GLD). The most popular ETF for silver is iShares Silver Trust (NYSE:SLV).
Oil
API crude inventories came at a build of 9.337M barrels, significantly more than the consensus.
The momo crowd is selling oil in the early trade. Smart money is inactive in the early trade.
For longer-term, please see oil ratings.
The most popular ETF for oil is United States Oil ETF (NYSE:USO).
Bitcoin
Bitcoin (CRYPTO: BTC) is range bound.
Protection Band And What To Do Now
It is important for investors to look ahead and not in the rearview mirror.
Consider continuing to hold good, very long term, existing positions. Based on individual risk preference, consider a protection band consisting of cash or Treasury bills or short-term tactical trades as well as short to medium term hedges and short term hedges. This is a good way to protect yourself and participate in the upside at the same time.
You can determine your protection bands by adding cash to hedges. The high band of the protection is appropriate for those who are older or conservative. The low band of the protection is appropriate for those who are younger or aggressive. If you do not hedge, the total cash level should be more than stated above but significantly less than cash plus hedges.
It is worth reminding that you cannot take advantage of new upcoming opportunities if you are not holding enough cash. When adjusting hedge levels, consider adjusting partial stop quantities for stock positions (non ETF); consider using wider stops on remaining quantities and also allowing more room for high beta stocks. High beta stocks are the ones that move more than the market.
Traditional 60/40 Portfolio
Probability based risk reward adjusted for inflation does not favor long duration strategic bond allocation at this time.
Those who want to stick to traditional 60% allocation to stocks and 40% to bonds may consider focusing on only high quality bonds and bonds of seven year duration or less. Those willing to bring sophistication to their investing may consider using bond ETFs as tactical positions and not strategic positions at this time.
The Arora Report is known for its accurate calls. The Arora Report correctly called the big artificial intelligence rally before anyone else, the new bull market of 2023, the bear market of 2022, new stock market highs right after the virus low in 2020, the virus drop in 2020, the DJIA rally to 30,000 when it was trading at 16,000, the start of a mega bull market in 2009, and the financial crash of 2008. Please click here to sign up for a free forever Generate Wealth Newsletter.
This article is from an unpaid external contributor. It does not represent Benzinga’s reporting and has not been edited for content or accuracy.